

Daily view
The daily view groups all your trades by closing day. It's the main tool for your daily review.
Trade groups by day
Each day appears as a two-level collapsible group:
Level 1 — Summary (collapsed):
- Date and total P&L for the day
- Win Rate
- Total number of trades
Level 2 — Detail (expanded) by clicking 'Show trades':
- Complete list of trades for the day, sorted by closing time
- For each trade: symbol, direction, profit/loss etc...
Expand / Collapse
- Expand/collapse all days at once
- Per day: Click Show trades in the day header to open/close
Chronological order
In Settings → Options, enable "Reverse days order" to see the oldest first (useful for chronological reading).
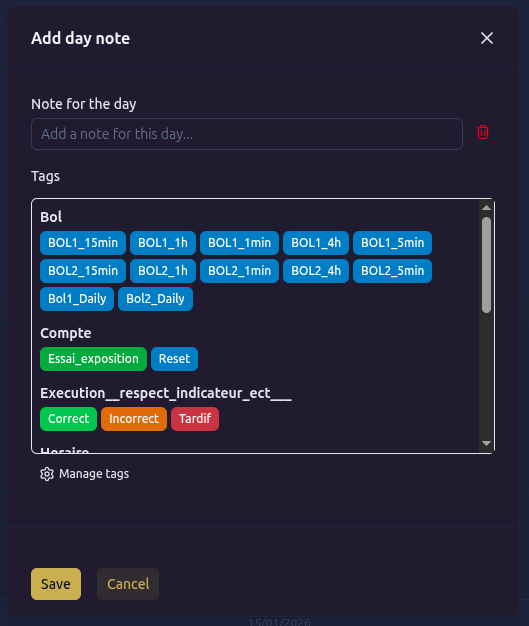
Daily tags
Assign tags to an entire day (independent of trade tags):
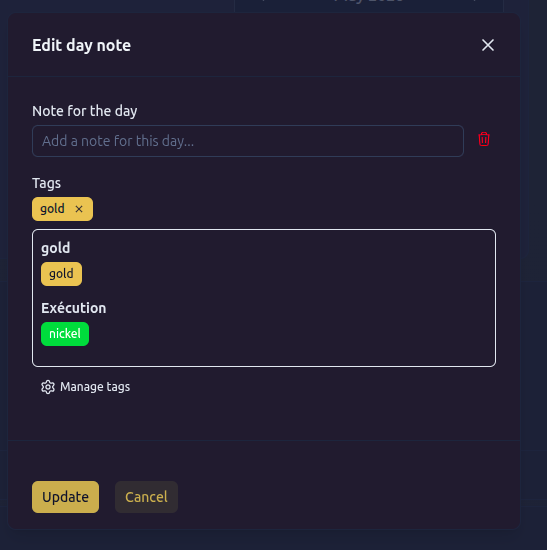
Examples of daily tags:
Disciplined day/Emotional dayFollowed plan/Deviated from planTrending market/Ranging market
Tags per trade
Assign tags to each individual trade (independent of day tags):
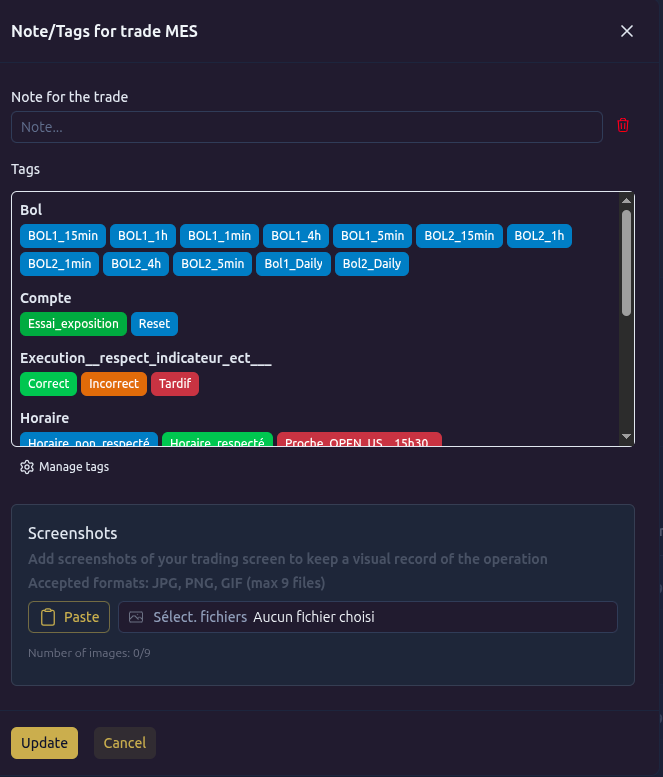
Examples of trade tags:
Breakout setup/Retest setupPerfect entry/Late entryTarget hit/Stop touched
Screenshots
Attach screenshots to trades to document your setups:
- Open a trade in the daily view
- Drag-and-drop or select an image
- The thumbnail appears in the trade form
Trade chart
Click a trade in the daily view to open its detail modal. If the symbol can be mapped to Polygon, a candlestick chart is displayed below the trade details.
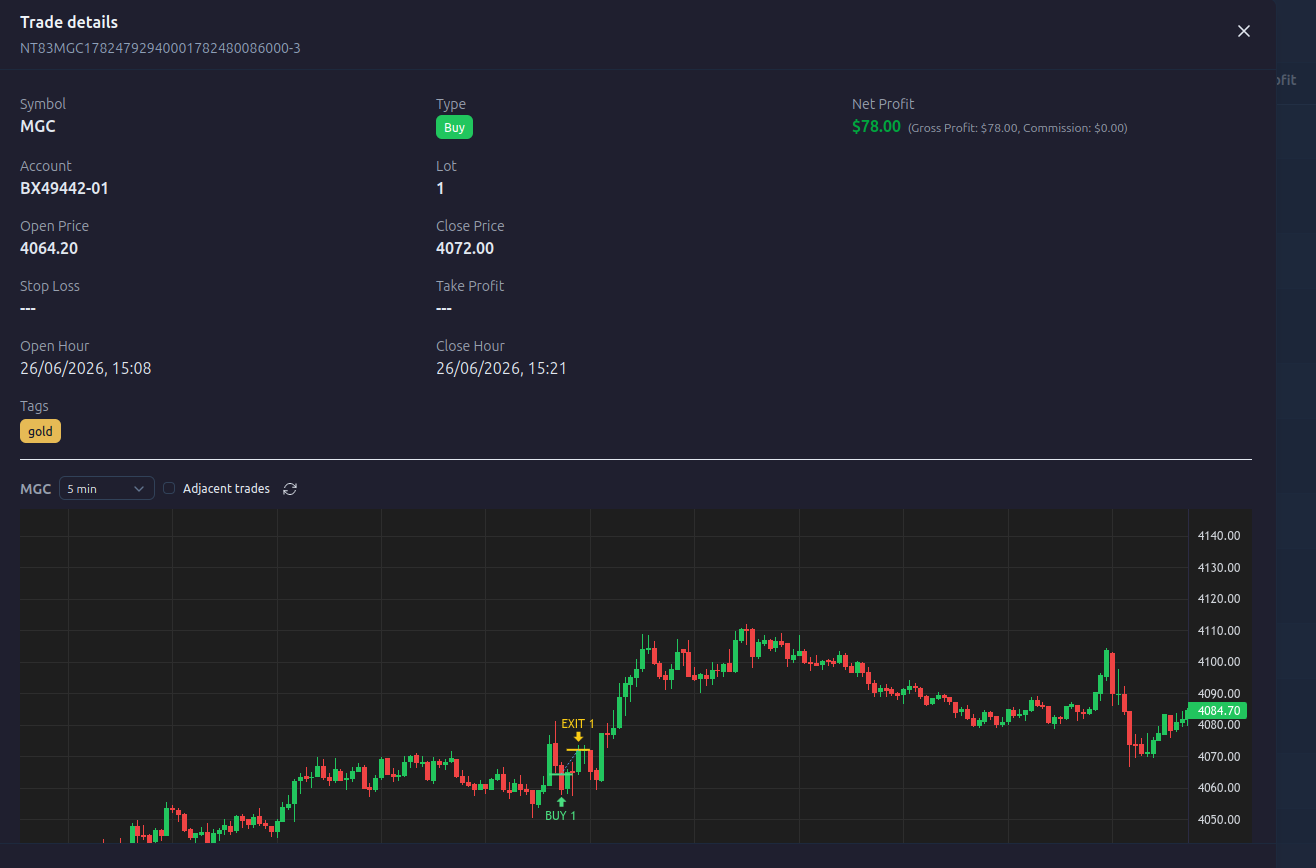
Available timeframes: 1 min, 5 min, 15 min, 1 hour, 4 hours, daily.
What is shown on the chart:
- Entry / exit markers: buy/sell arrows and a dashed line connecting the entry and exit prices
- Exact price levels: short horizontal lines at the entry and exit prices
- Adjacent trades: toggle Show adjacent trades to overlay other trades on the same symbol in the visible range
- Reload button: refetches the bars from Polygon, useful after editing a symbol alias
The chart uses the timezone configured in Settings → Options. The data is fetched from Polygon.io and cached locally in the browser.
For technical details (symbol mapping, spgn aliases, cache, rate limiting), see the trade chart developer reference.
Side P&L calendar
A mini-calendar appears on the right side of the page (toggleable in Settings → Options):
- Quick navigation between months
- Click a day to open the trades for that day
- Days are colored based on P&L
Filters
The same advanced filters as on the dashboard and trades apply here.